How to Use the Infographic Creator (Beta Version)
The Infographic Creator you see here is currently in beta. This means it’s an early release designed to let users experiment with layout ideas, but it will not render your inputted text correctly. Instead, it focuses mainly on organizing your infographic’s structure and basic design.
If you need a fully editable version with correct text formatting, a simple workaround is available: after creating your infographic, import it into Canva (or a similar graphic editor) and use the “Detect Text” tool. This feature allows you to identify and replace the placeholder text quickly, making your infographic fully editable and polished.
Understanding Infographics: Types and Best Uses
Infographics are powerful visual tools that help simplify complex information, making it more engaging and easier to understand. Whether you’re presenting research, explaining a process, or telling a story, a well-designed infographic can significantly boost your audience’s comprehension and retention.
Here’s a quick overview of what you can create with this tool and when to use each infographic type:
Timeline Infographic
Perfect for showing how something has evolved over time. Use it for historical events, company milestones, project timelines, or future roadmaps. It presents information sequentially, making it ideal when chronology matters.
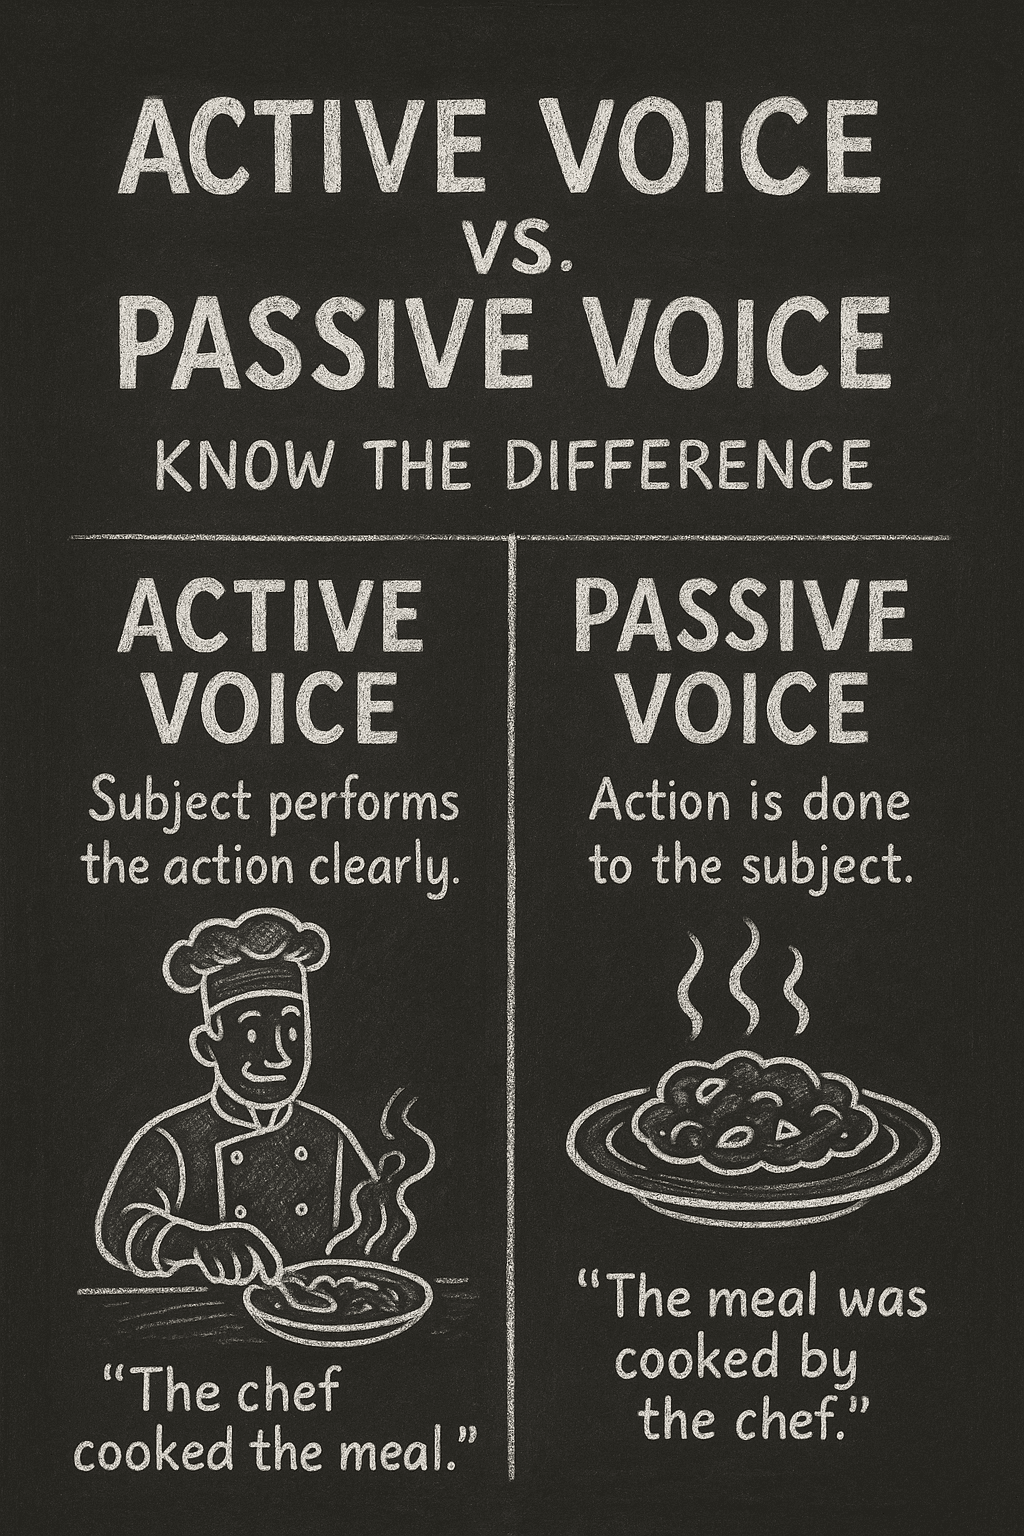
Comparison Infographic
Use this when you want to highlight similarities and differences between two or more items. It’s great for comparing products, services, options, or even ideas, helping readers make informed decisions quickly.
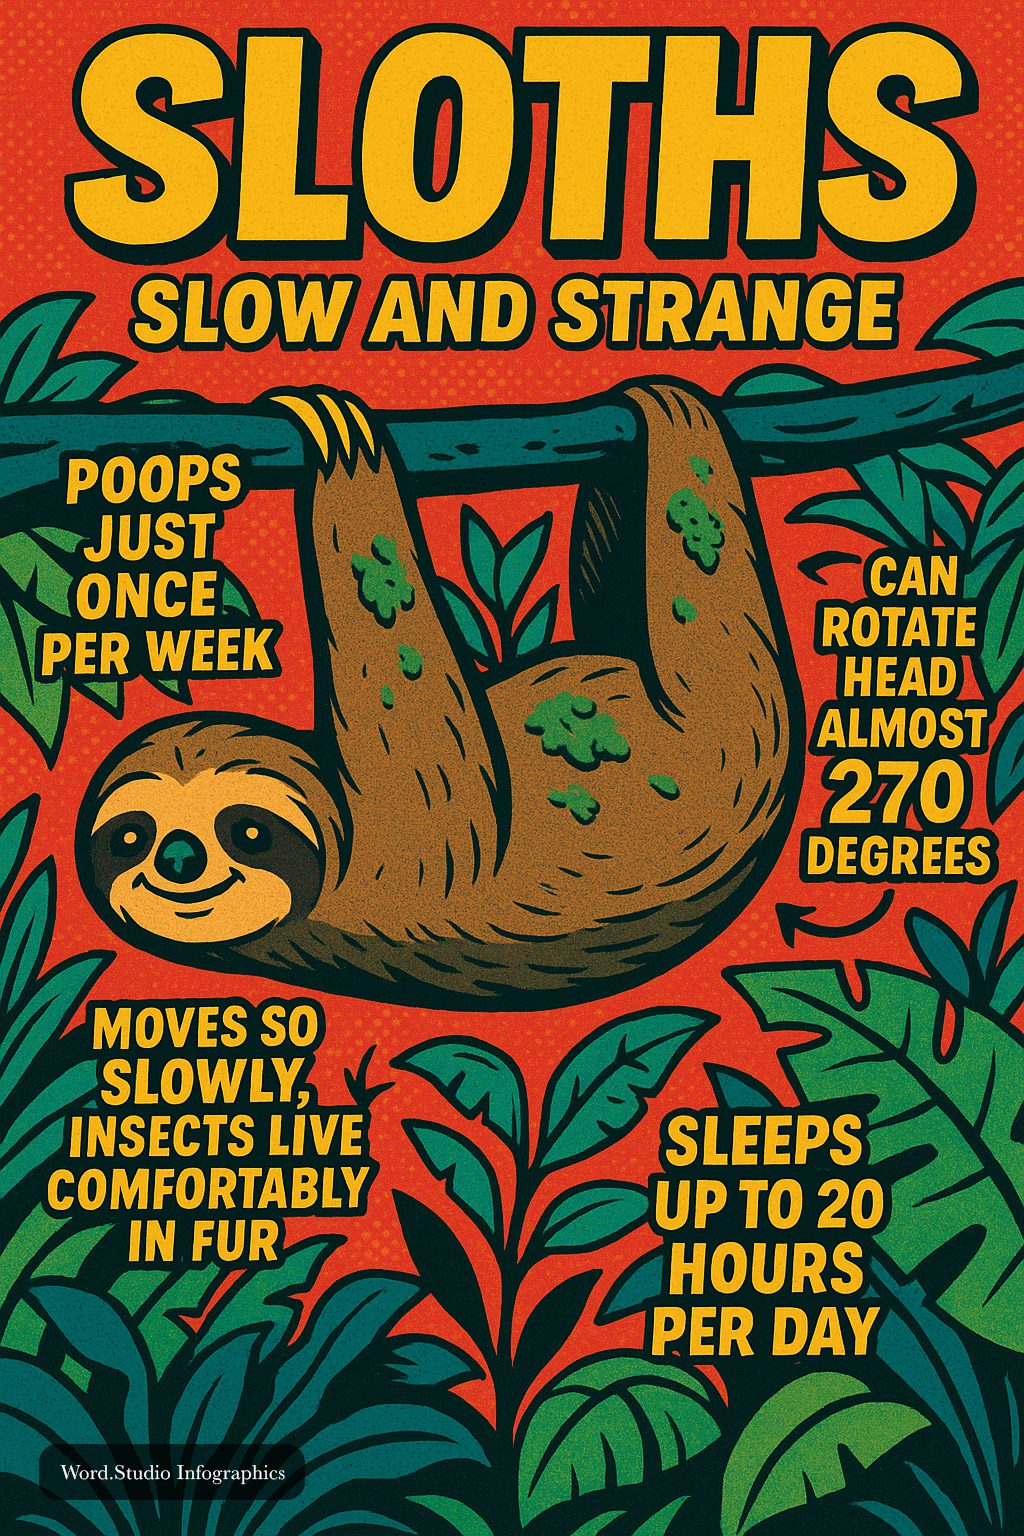
Statistical Infographic
Best for presenting data-heavy content. If you have survey results, market research, or big datasets, a statistical infographic can turn numbers into visual insights using charts, graphs, and bold figures.
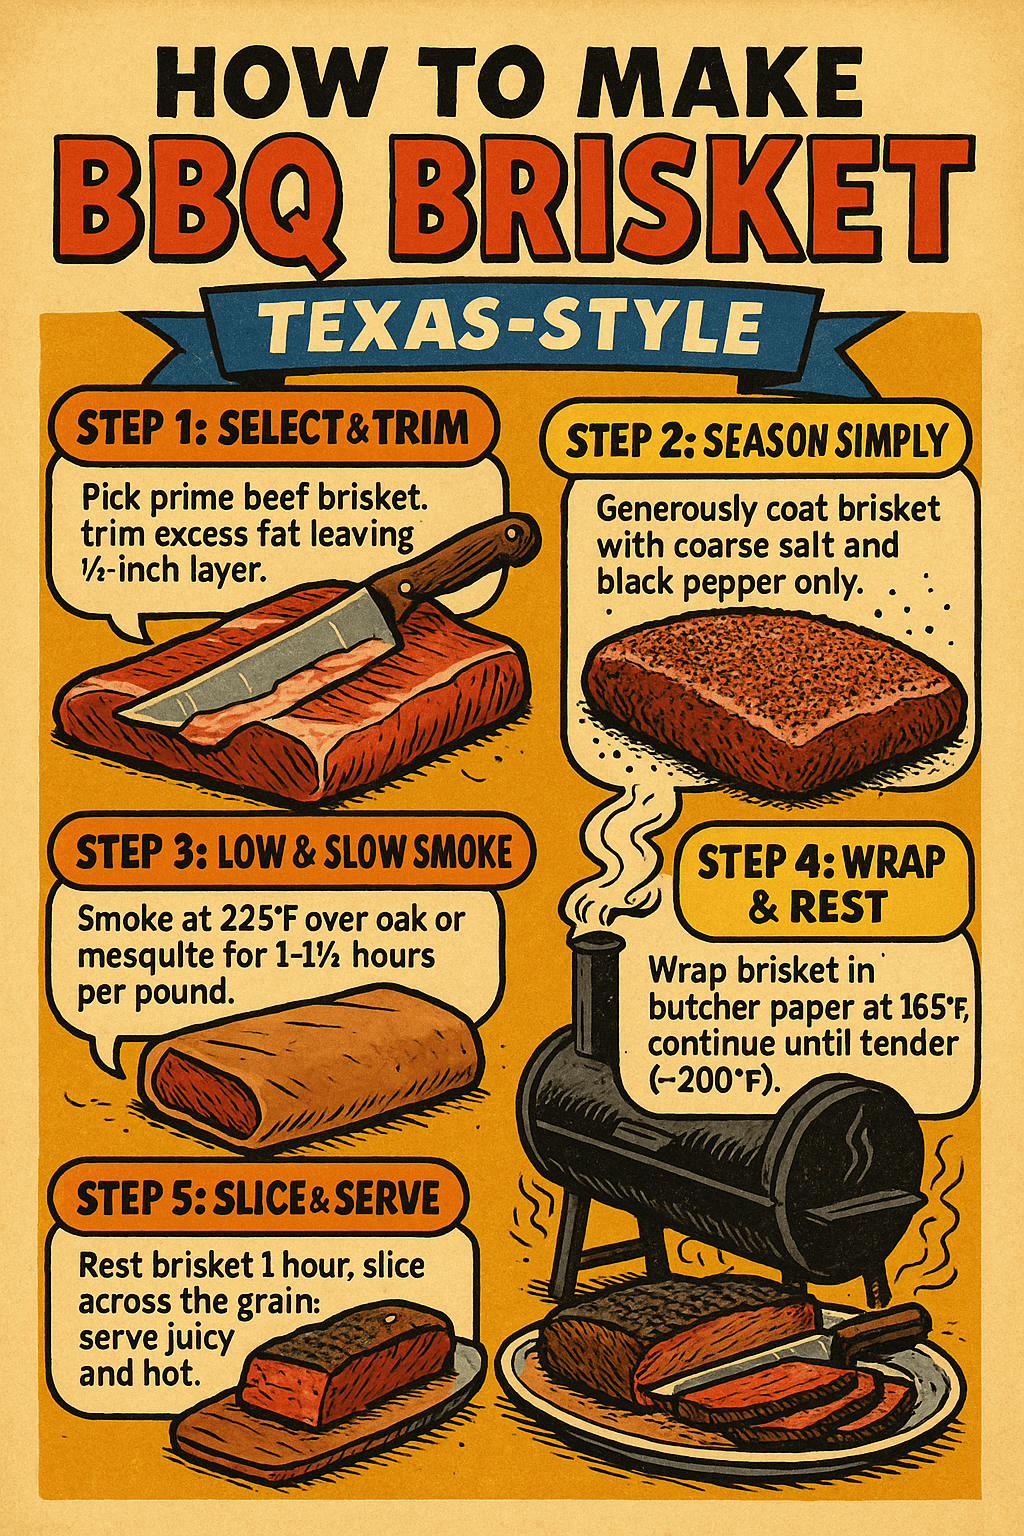
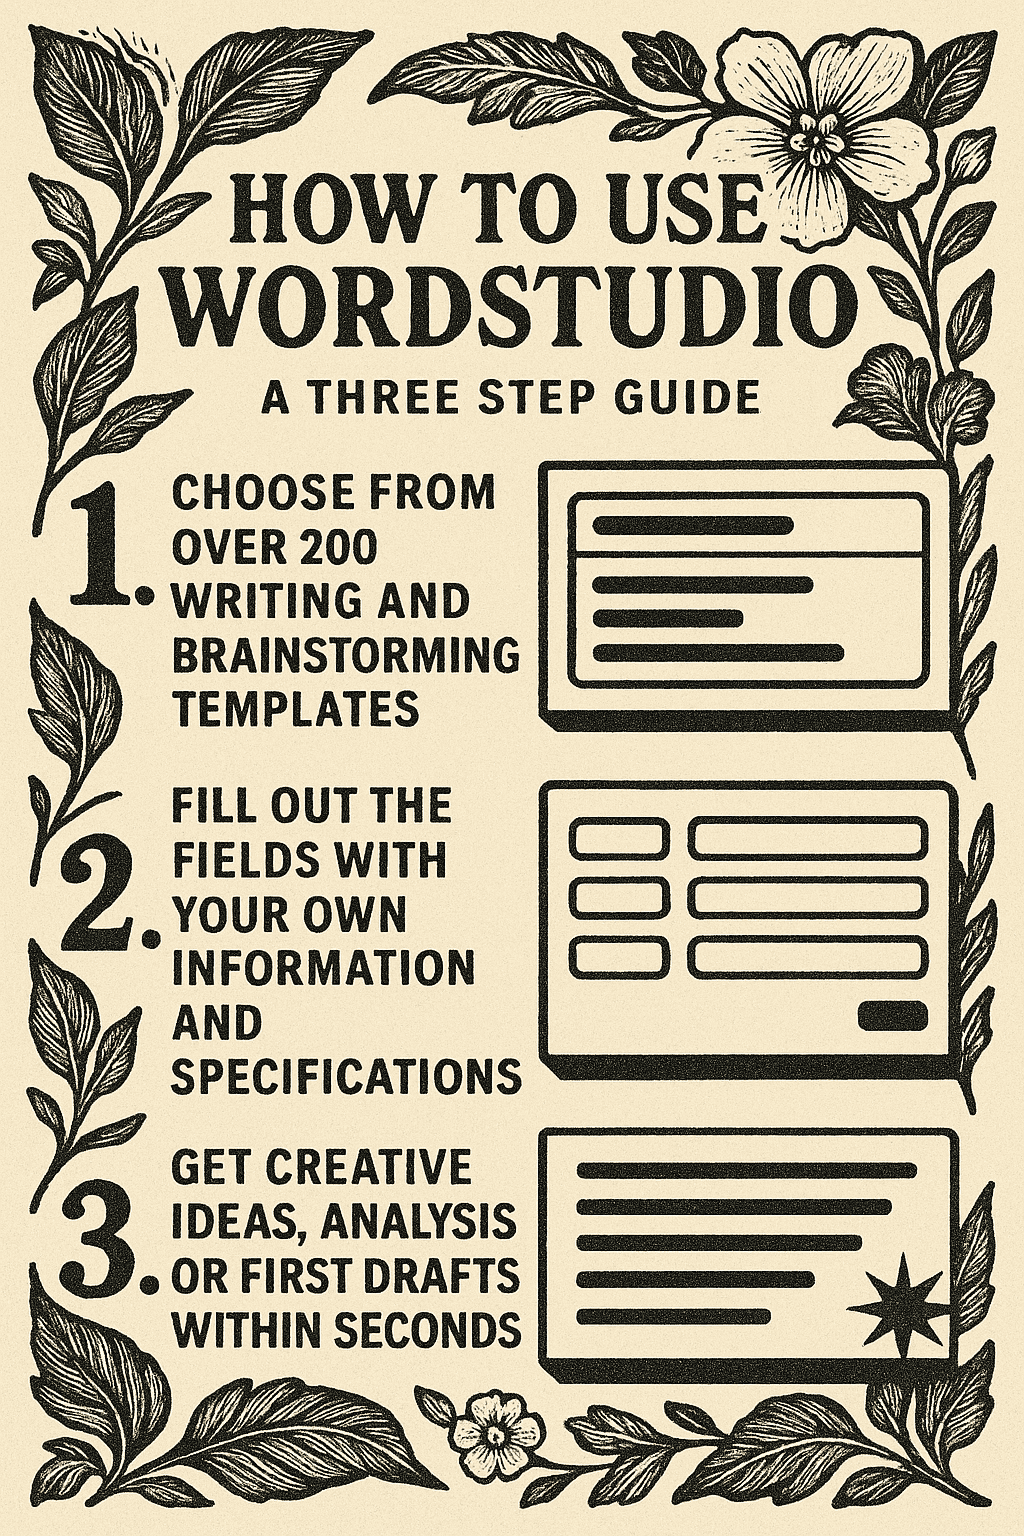
Process Infographic
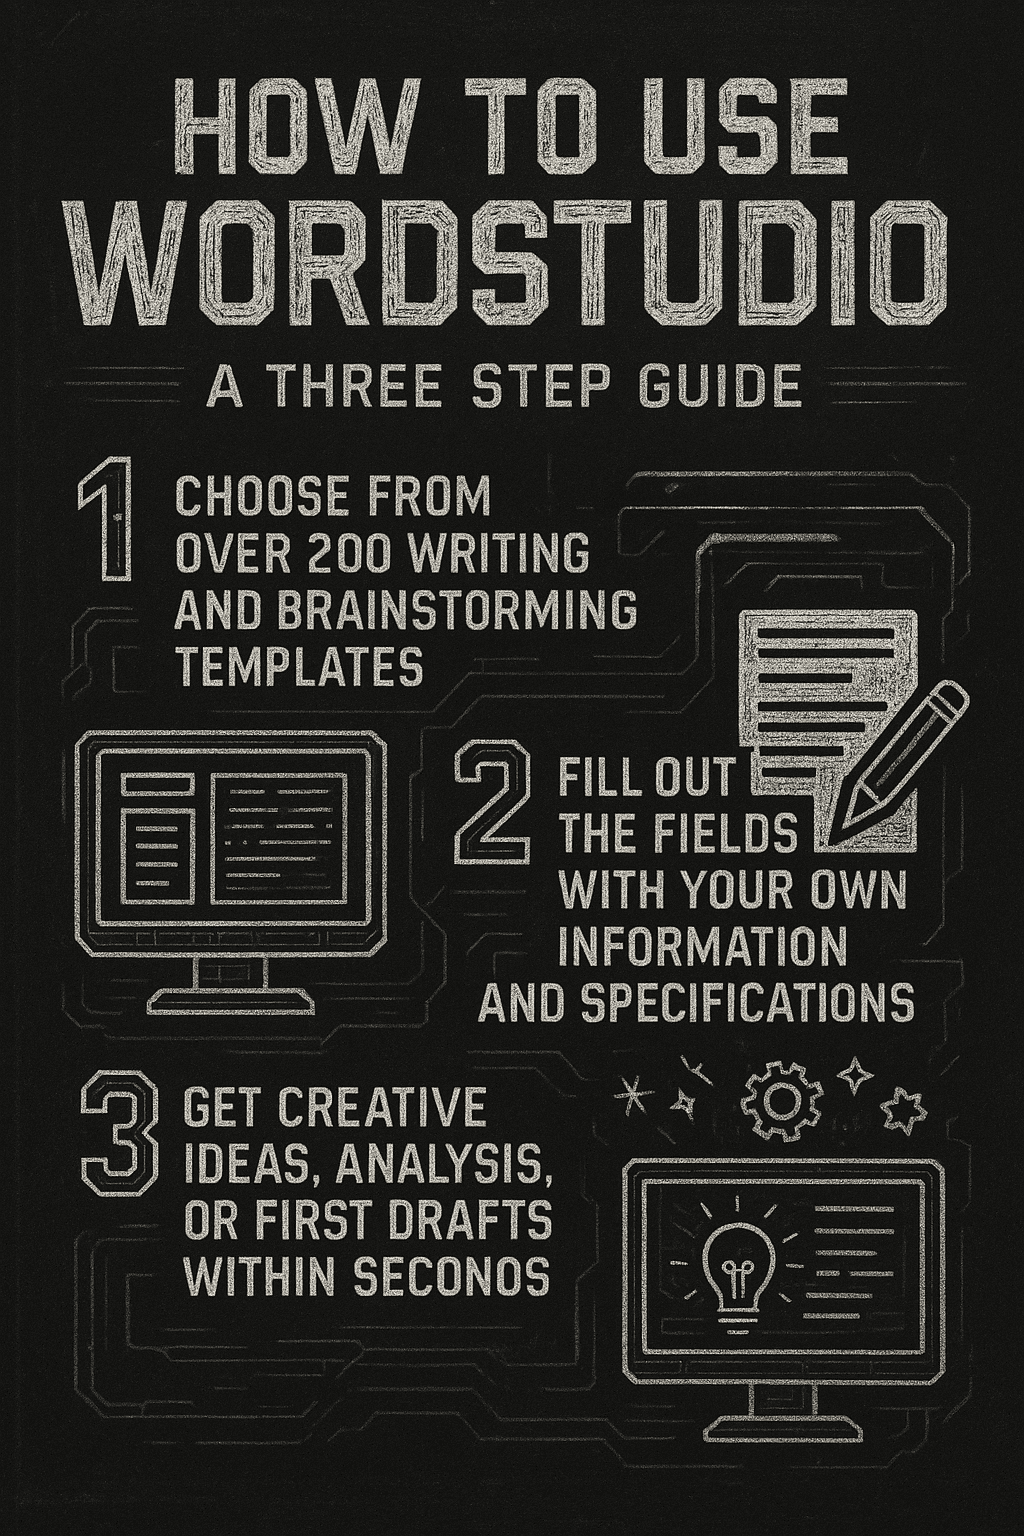
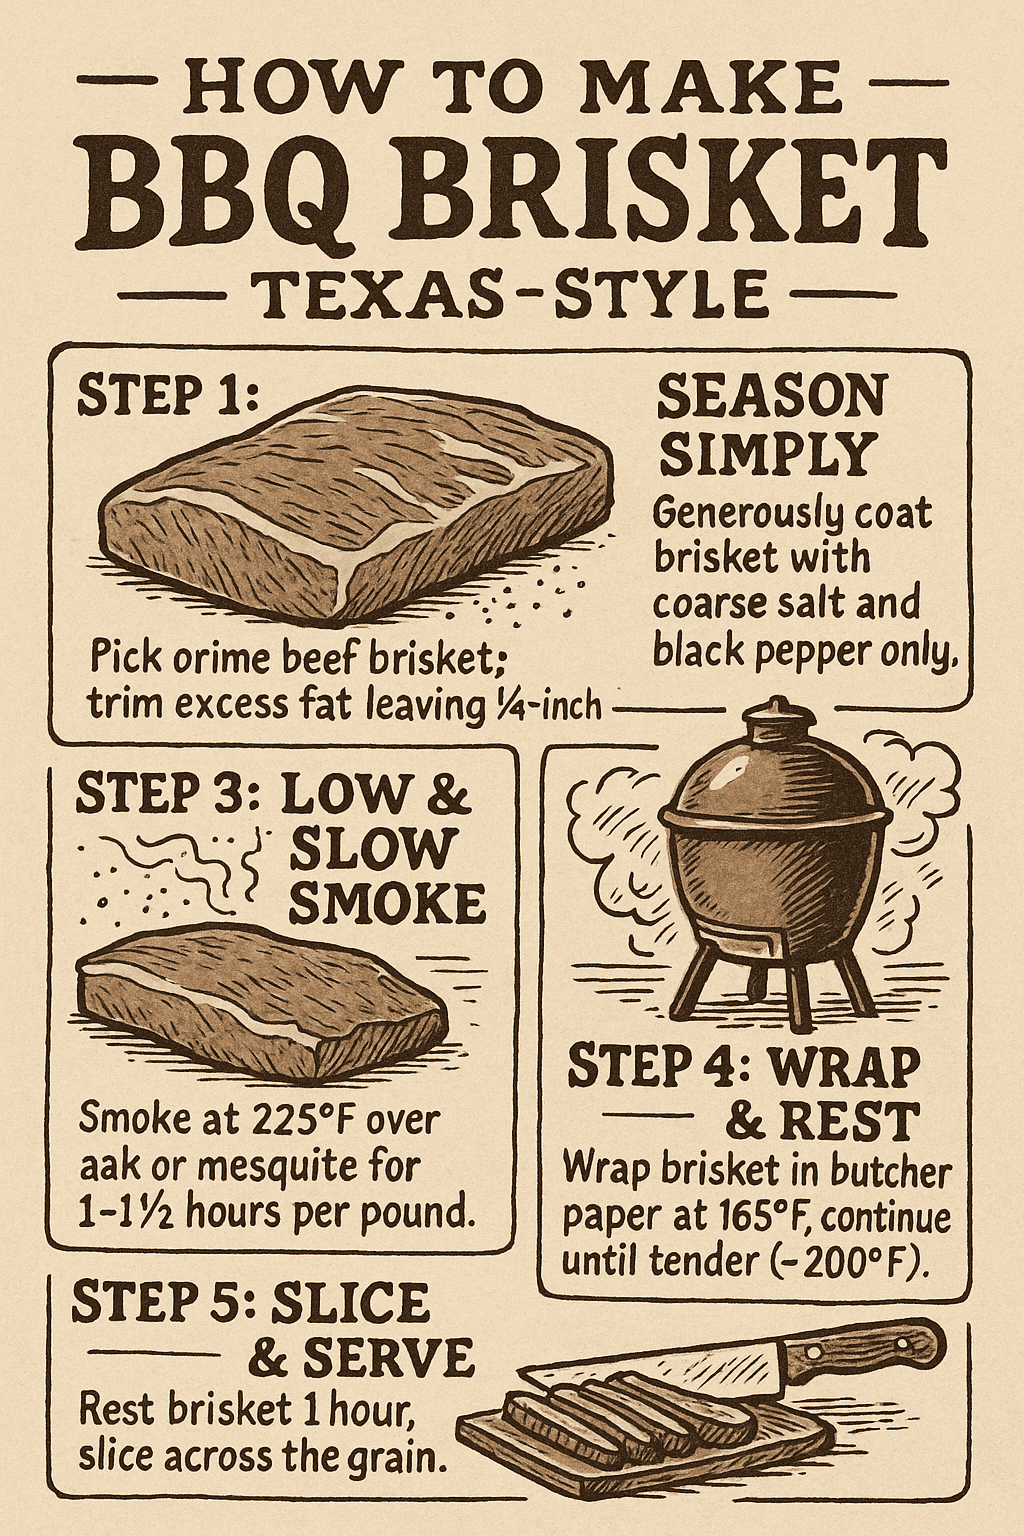
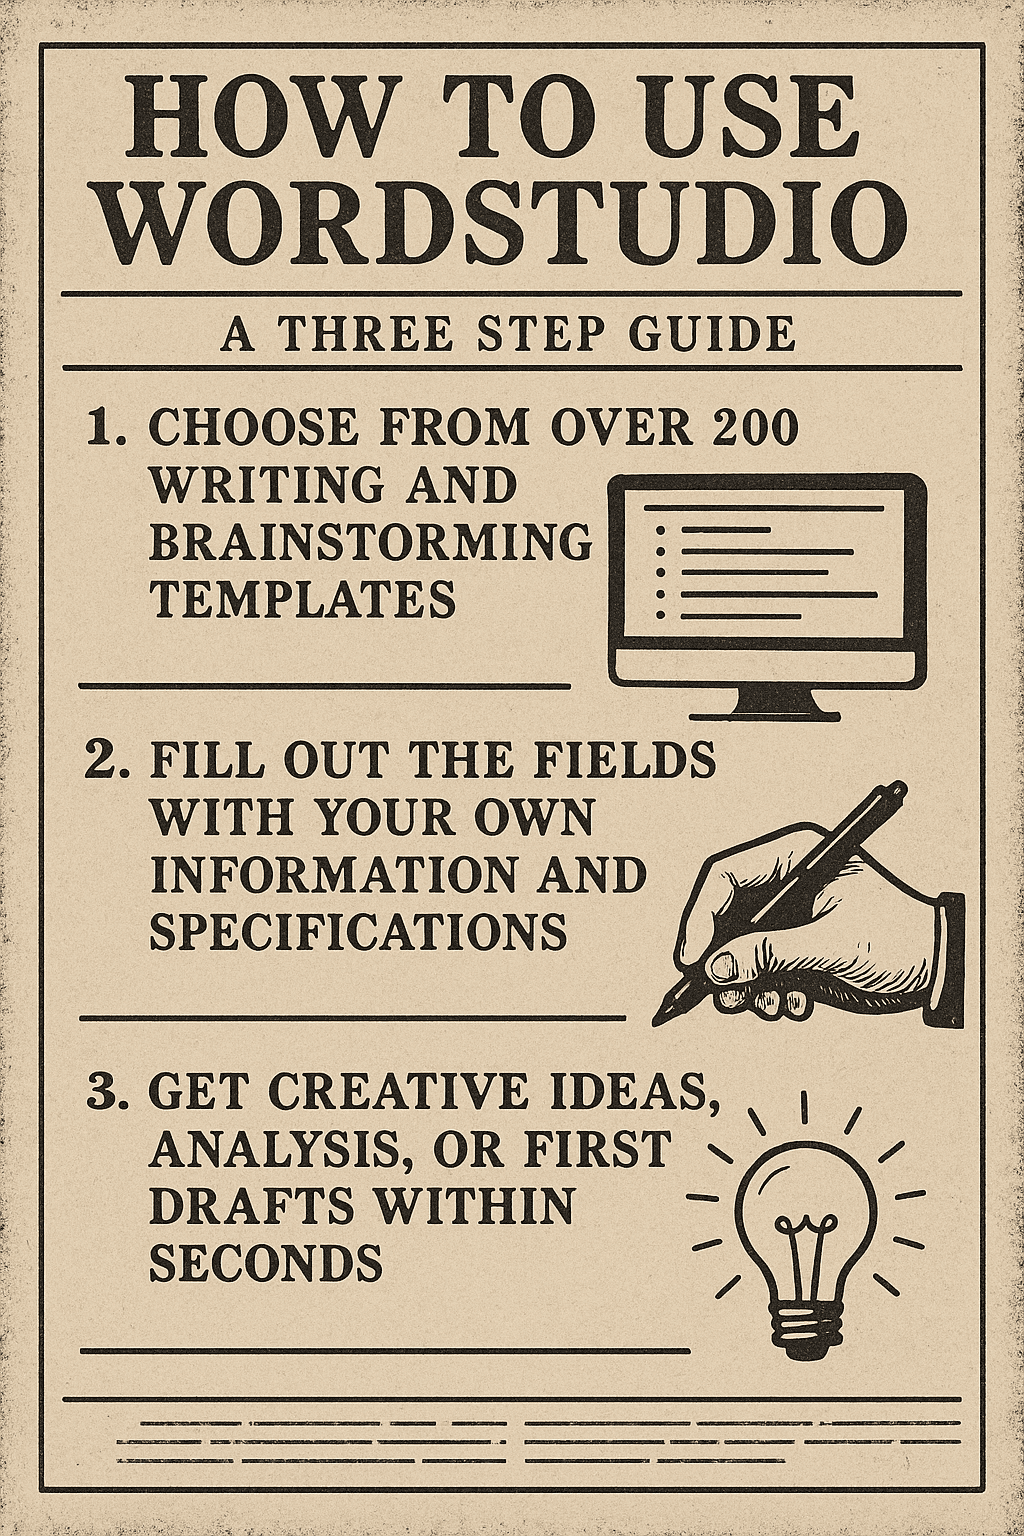
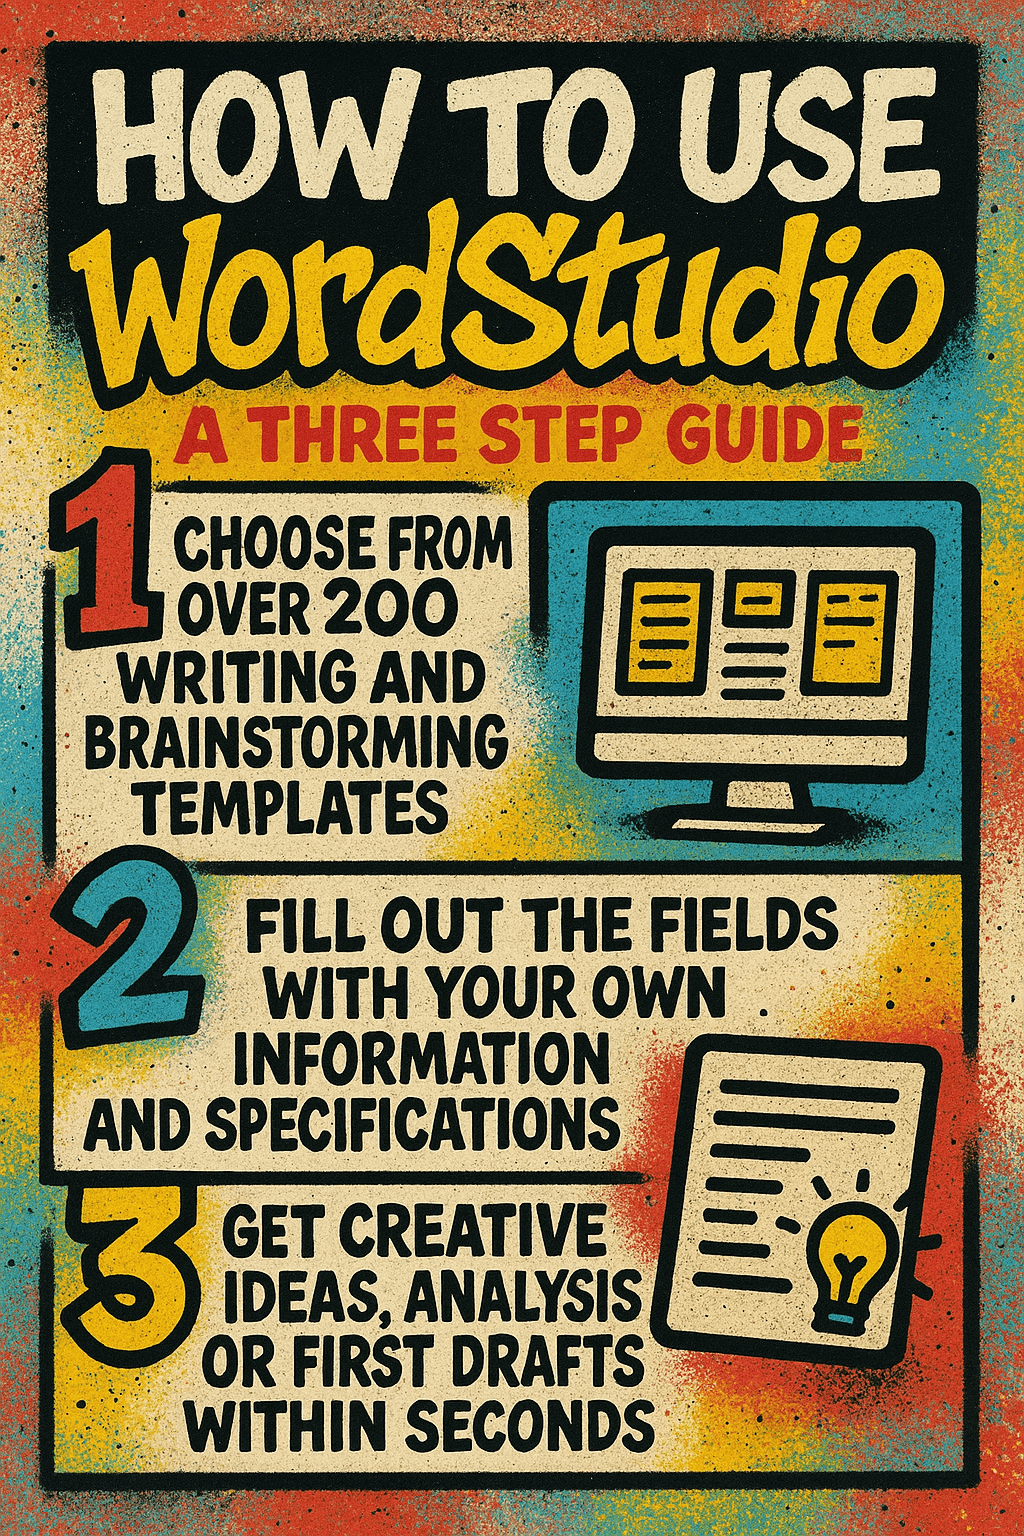
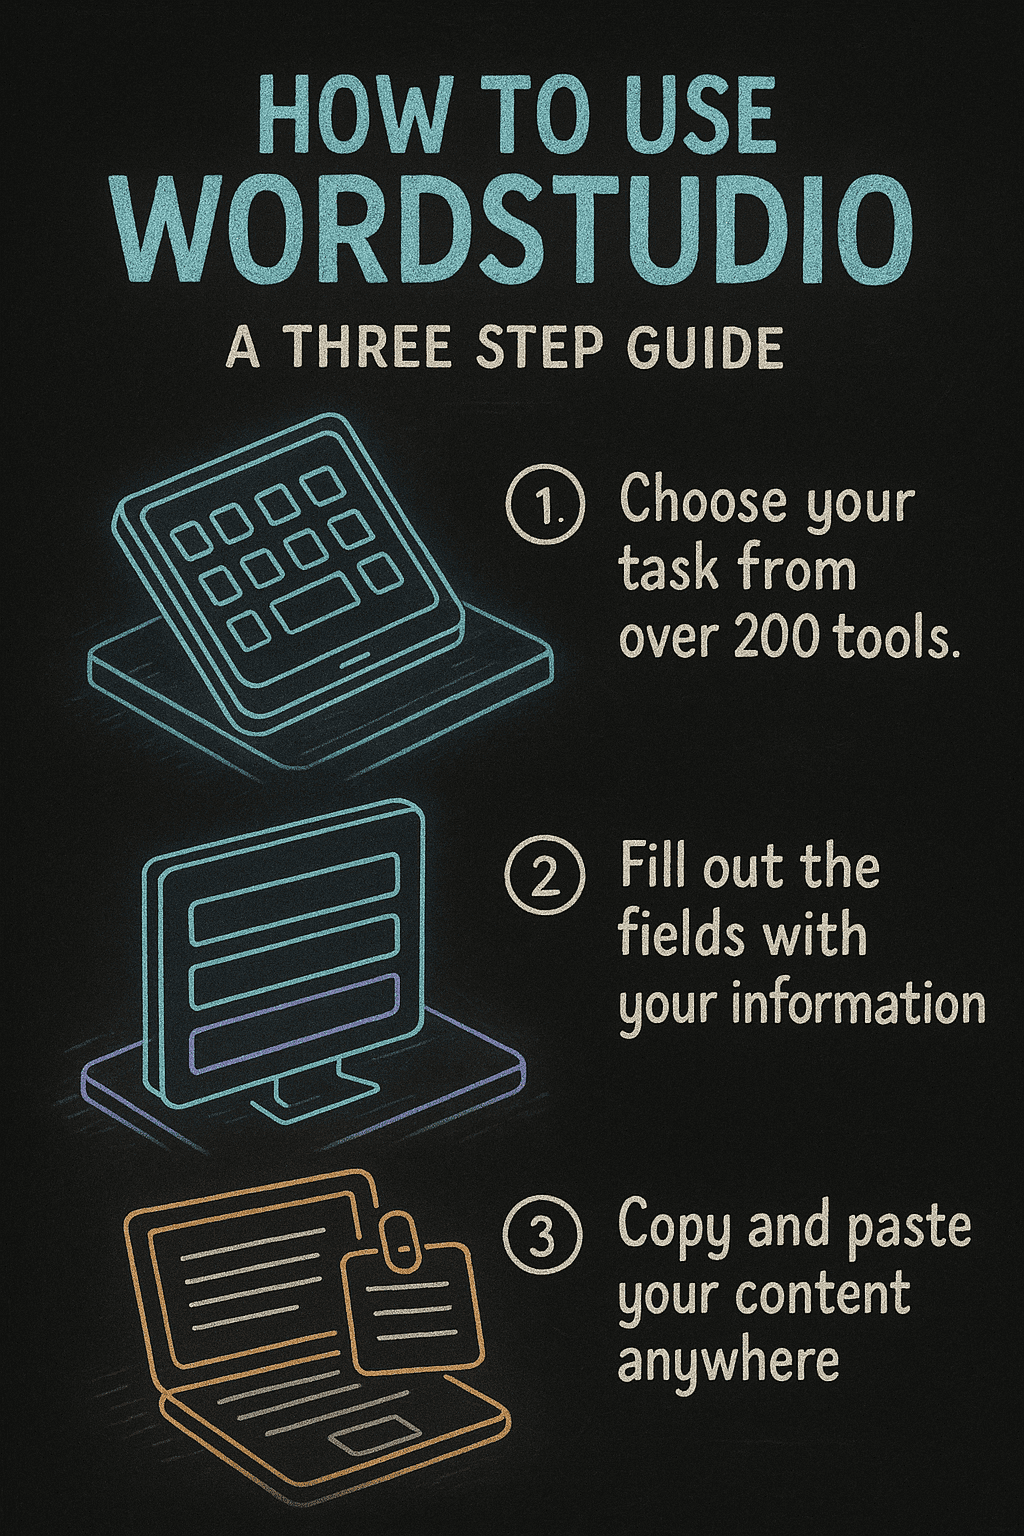
If you need to explain steps in a workflow, tutorial, or recipe, a process infographic is ideal. It breaks down complicated tasks into manageable steps, making it easier for your audience to follow instructions or understand a system.
Geographic Map Infographic
Perfect for visualizing data across different locations. Use it to show regional statistics, demographic distributions, travel itineraries, or market expansions, adding spatial context to your information.
Best Practices for Creating Infographics
- Know Your Goal: Before you start, define what you want the infographic to achieve — inform, persuade, entertain, or educate.
- Focus on Clarity: Keep your information concise and organized. Every element should have a clear purpose.
- Use Visual Hierarchy: Guide the reader’s eyes through the content naturally using headings, colors, and size contrasts.
- Stay on Brand: If you’re creating an infographic for a business or organization, stick to brand colors, fonts, and tone of voice.
- Make it Shareable: Good infographics are easy to share across social media, blogs, and presentations, helping your message reach more people.
Now, let’s walk through how to use the tool effectively:
Filling Out the Fields
Title of the Infographic:
Enter a short, clear headline that captures the main idea. Think of something catchy and informative.
Target Audience:
Specify who the infographic is for. A clear audience helps you focus the design and language appropriately.
Description & Sections / Body Text:
Outline the structure of your infographic. You can paste your body copy directly here, using headings like “Section 1: Overview,” “Section 2: Data,” and so on. This will guide the layout.
Choosing Infographic Options
Type of Infographic:
Select the general format you want (e.g., timeline, comparison, list, process). This determines the layout structure.
Style:
Pick a style that matches your topic’s tone — for instance, professional, playful, minimalist, etc.
Custom Style (Optional):
If you have specific branding or stylistic preferences, you can choose or later customize using external editors like Canva.
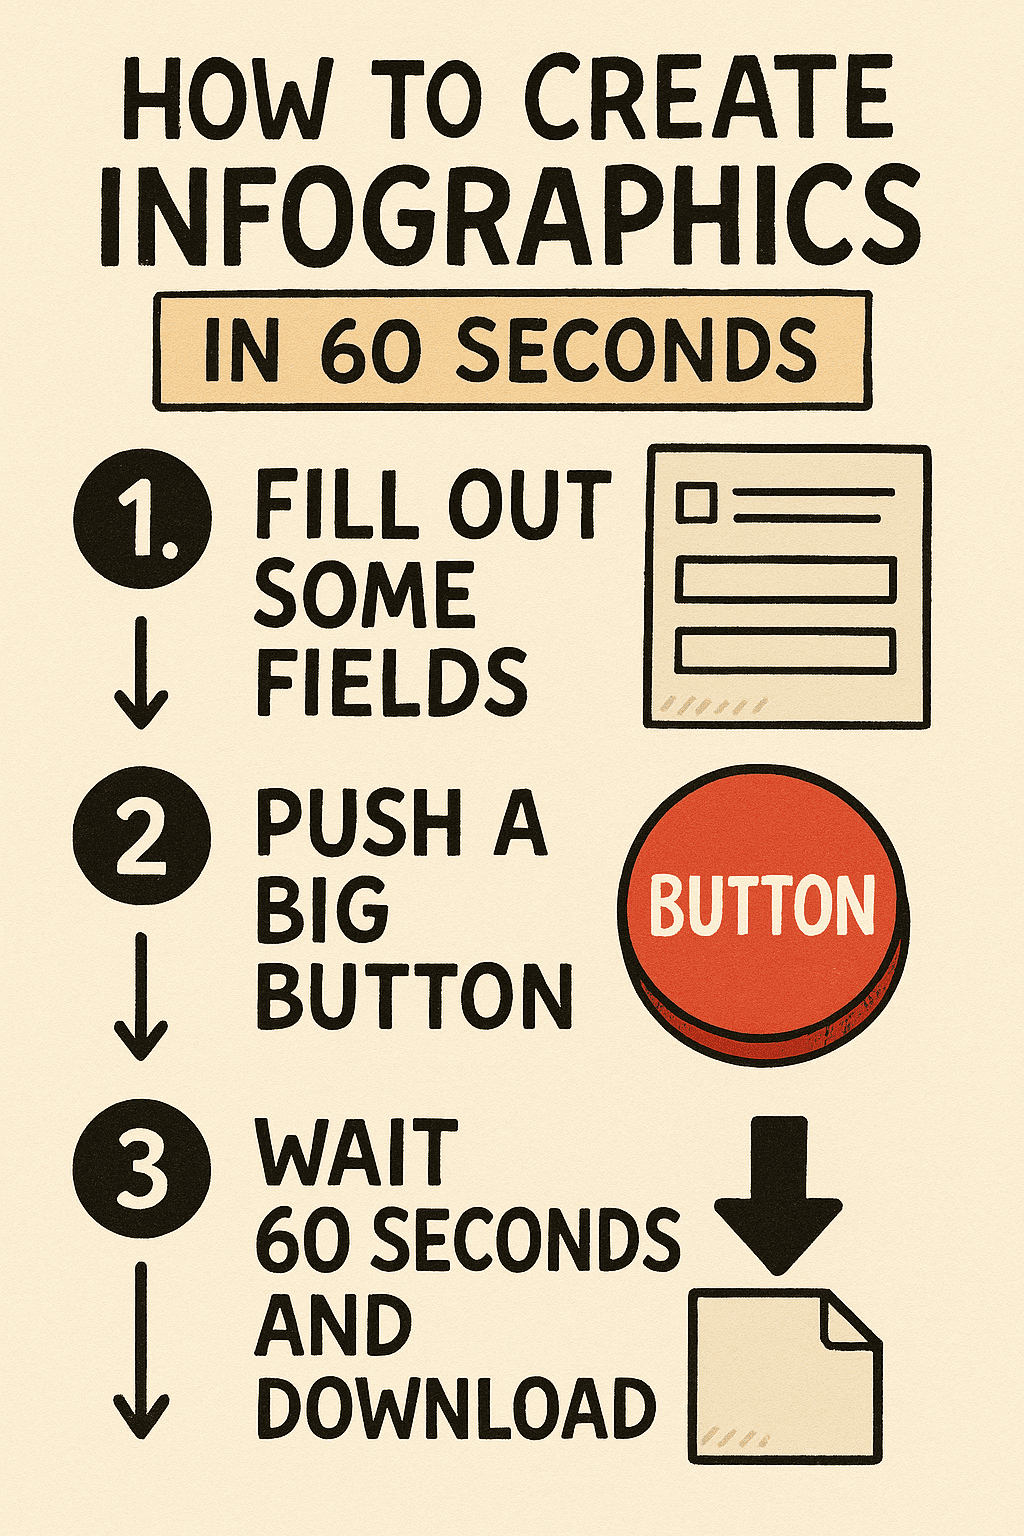
Final Step: Create Your Infographic
Once all fields are filled, click “Create an Infographic.”
Remember, the beta version means you’re generating a draft layout. For final use, import your design into Canva and use “Detect Text” to polish it up professionally.